Start with a game
Pick any positive whole number. Any number at all.
Now follow two rules:
- If it's even, divide it by 2.
- If it's odd, multiply it by 3 and add 1.
Repeat. Keep going. What happens?
Try it with 6: 6 → 3 → 10 → 5 → 16 → 8 → 4 → 2 → 1
Try it with 27: 27 → 82 → 41 → 124 → 62 → 31 → 94 → 47 → 142 → 71 → 214 → ...
That second one takes 111 steps before it finally crashes down to 1. It shoots up to a peak of 9,232 along the way, before eventually, inevitably, collapsing.
The conjecture, proposed by German mathematician Lothar Collatz in 1937, is this:
No matter which positive integer you start with, you will always eventually reach 1.
Simple to state. Seemingly obvious after a few tries. And yet completely unproven.
Why is this hard?
At first glance, it feels like it should be provable. The even rule (÷2) pulls numbers down. Surely the odd rule (×3+1) can't keep things climbing forever?
The problem is that mathematics doesn't work on intuition. A formal proof needs to work for every number, including the ones so large they've never been tested. And the sequence behaves chaotically. There's no obvious pattern to exploit.
Mathematician Paul Erdős, one of the most prolific in history, once said:
"Mathematics is not yet ready for such problems."
As of 2024, the conjecture has been verified computationally for all numbers up to approximately 2.95 × 10²⁰ — that's 295 quintillion. Still not a proof. Not even close to one.
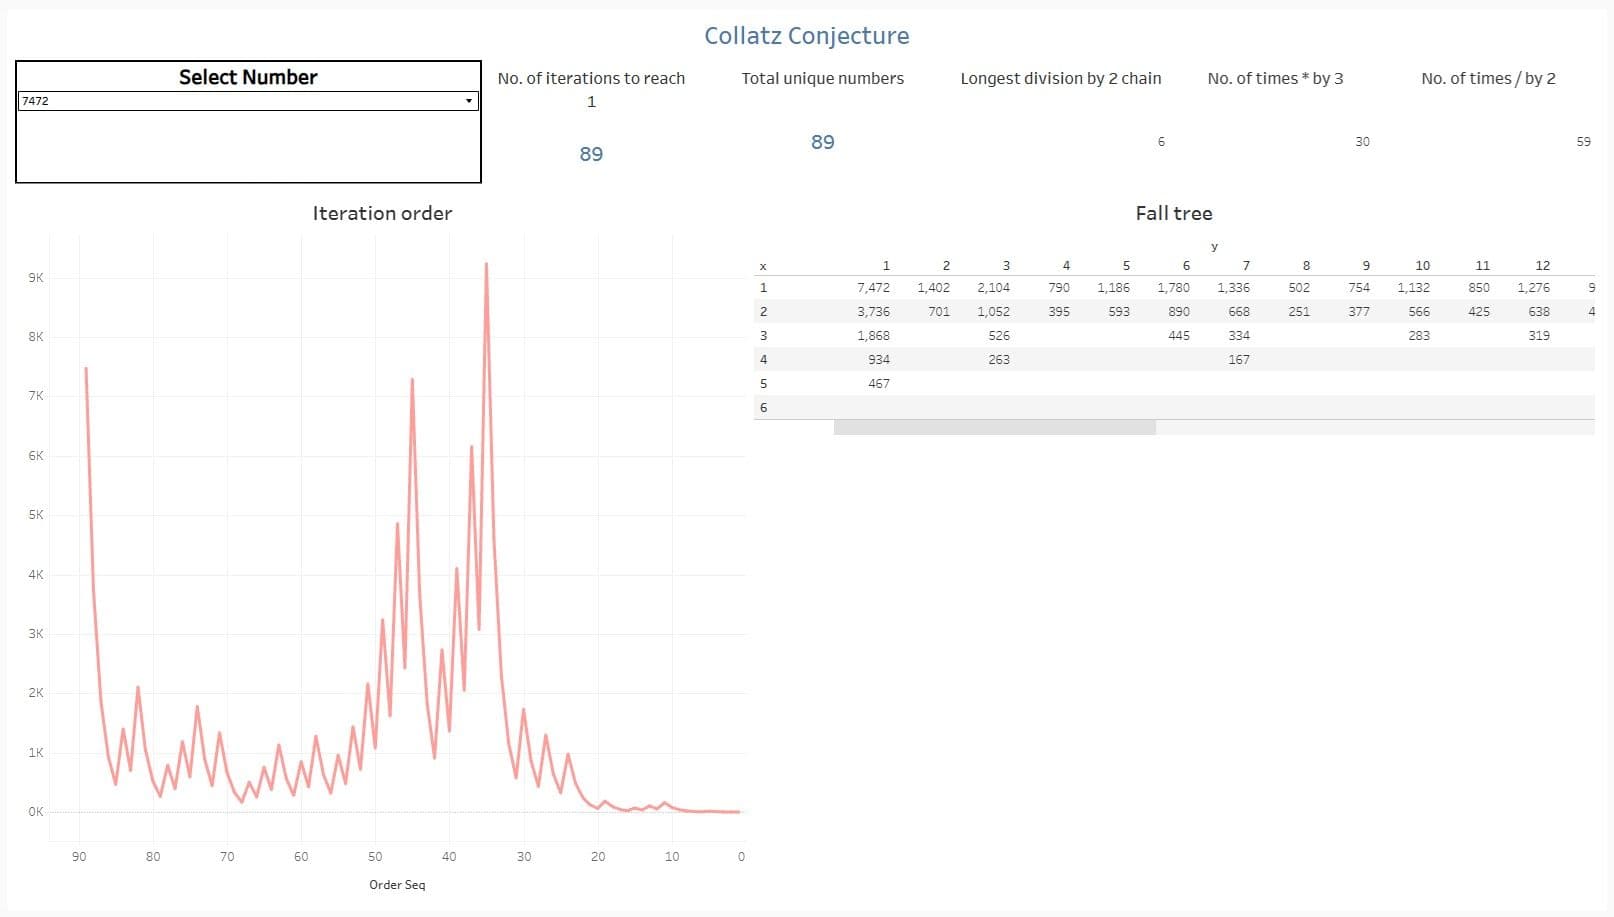
What the visualization shows
I built an interactive Tableau visualization to explore what this sequence actually looks like for different starting numbers. Select any number and you get two views: an Iteration order chart that plots the full journey of the sequence as a line graph, and a Fall tree that breaks the path down into its ×3+1 and ÷2 components in a structured grid.
→ View the interactive viz on Tableau Public
Take 7,472 as an example. It takes 89 iterations to reach 1. The line chart shows the sequence meandering at relatively low values for the first 50 or so steps, then suddenly surging to a peak of around 9,400, before cascading down sharply to zero. That visual shape, the chaotic climb followed by the inevitable collapse, captures something no equation alone can convey.
A few things that stand out across different numbers:
1. Stopping times are wildly irregular You might expect that larger starting numbers take longer to reach 1. They don't, not reliably. 27 takes 111 steps. 32, which is much larger, takes just 5. The relationship between a number and how "hard" it is to tame is essentially unpredictable.
2. The peaks are dramatic Some numbers spike to values many times their starting point before descending. 27 climbs to 9,232, more than 340 times its starting value, before finally coming down. Watching this as a line chart makes the chaos viscerally real.
3. There are patterns, but no formula The fall tree in the visualization reveals the internal structure of each sequence: how many times the ×3+1 rule fired, how long the longest consecutive ÷2 chain was. You can see patterns emerging across numbers. But no one has been able to turn those patterns into a rigorous mathematical proof.
Why does this matter?
Honestly? In a practical sense, it doesn't. There's no known real-world application riding on whether Collatz is true or false.
But that's exactly what makes it compelling.
It sits at the boundary of what human knowledge can currently reach. It's a reminder that mathematics, the most precise language we have, still has rooms we can't unlock. The Collatz Conjecture is a window into the gap between what we can observe and what we can prove.
For me personally, it was also a great exercise in data visualization: taking something abstract and recursive and making it visible. The moment a sequence path becomes a line on a chart, something clicks that no equation can replicate.
Try it yourself
The rules again:
- Even? → Divide by 2
- Odd? → Multiply by 3, add 1
- Repeat until you reach 1
Pick a number. See how long it takes. Then wonder, just for a moment, whether anyone will ever prove it has to end.
That's the Collatz Conjecture. Still open. Still waiting.
Explore the interactive visualization here: Collatz Conjecture on Tableau Public